1
2
3
4
5
6
7
8
9
10
11
| import numpy as np
import pandas as pd
import matplotlib.pyplot as plt
import matplotlib as mpl
import seaborn as sns
sns.set(color_codes=True)
np.random.seed(sum(map(ord,"regression")))
tips = sns.load_dataset("tips")
tips.head()
|
|
total_bill |
tip |
sex |
smoker |
day |
time |
size |
| 0 |
16.99 |
1.01 |
Female |
No |
Sun |
Dinner |
2 |
| 1 |
10.34 |
1.66 |
Male |
No |
Sun |
Dinner |
3 |
| 2 |
21.01 |
3.50 |
Male |
No |
Sun |
Dinner |
3 |
| 3 |
23.68 |
3.31 |
Male |
No |
Sun |
Dinner |
2 |
| 4 |
24.59 |
3.61 |
Female |
No |
Sun |
Dinner |
4 |
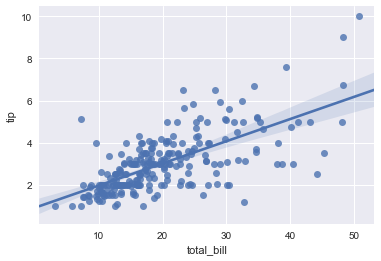
regplot()和lmplot()都可以绘制回归关系,推荐使用regplot()
1
2
| sns.regplot(x = "total_bill",y="tip",data=tips)
<matplotlib.axes._subplots.AxesSubplot at 0x1a17cb5668>
|
1
2
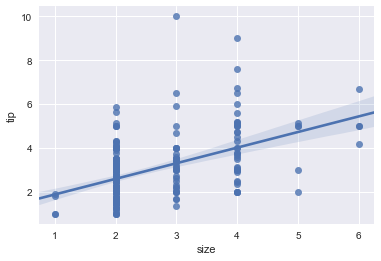
| sns.regplot(data=tips,x="size",y="tip")
<matplotlib.axes._subplots.AxesSubplot at 0x1a17bf8ac8>
|
1
2
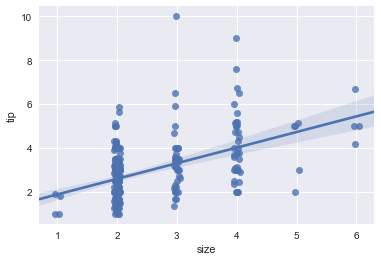
| sns.regplot(data=tips,x="size",y="tip",x_jitter=0.05)
<matplotlib.axes._subplots.AxesSubplot at 0x1a17e29b70>
|
# seaborn