1
2
3
4
5
6
7
| import numpy as np
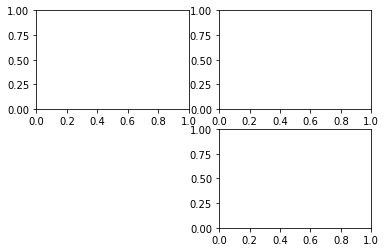
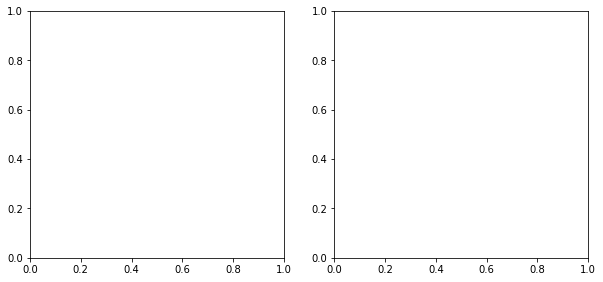
fig = plt.figure(figsize=(10,10))
ax1 = fig.add_subplot(2,2,1)
ax2 = fig.add_subplot(2,2,2)
fig.show()
/anaconda3/lib/python3.6/site-packages/matplotlib/figure.py:459: UserWarning: matplotlib is currently using a non-GUI backend, so cannot show the figure
"matplotlib is currently using a non-GUI backend, "
|